
Author: eyworks
Running a successful nursery in 2026 takes more than exceptional care and teaching. With tight margins, rising staff costs, and unpredictable occupancy, financial pressures are the norm. But the nurseries that thrive in this climate aren't necessarily the ones with the biggest budgets. They're the ones who track the right metrics and make financially smart decisions.
Most managers track their total profit and loss statements and monthly revenue. These are the headline numbers. They don't tell you why you're profitable or not. More importantly, they don't show you which operational levers to pull when margins start to slip.
Smart financial management means tracking specific numbers that tell you what's actually happening in your business and where to focus your attention.
Here are five operational metrics every nursery owner should monitor monthly. These aren't complex calculations that require an accounting degree. They're practical indicators you can track and act on.
1. Revenue density: headcount vs full-time equivalent (FTE) utilisation
Most nursery managers know their occupancy percentage off the top of their heads. However, a simple headcount is often misleading. For example, you might have 40 children in a room, but if half of them attend only two days a week, the room's revenue density is dangerously low.
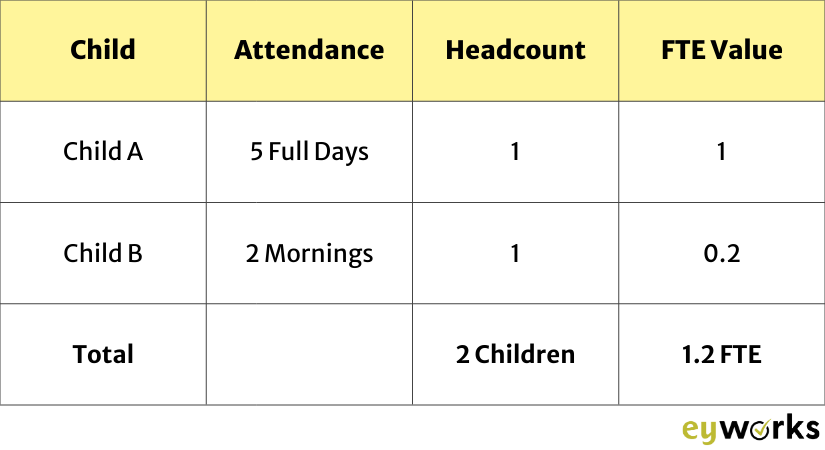
That’s why you need to track occupancy by full-time equivalent, not just head count. An FTE calculation shows you what percentage of your available slots are actually generating income. A child attending 20 hours per week in a 50-hour setting is 0.4 FTE, not one child.
Here’s an example showing how headcount can be a vanity metric that masks a revenue problem:
What to track:
- The occupancy/FTE report: Run this report to compare your headcount occupancy against your FTE occupancy.
- Occupancy patterns: Identify time slots and rooms with low utilisation.
Why it matters: Empty places mean you’re losing money every month, and those losses add up. If your pre-school room runs at 65% occupancy, you're leaving thousands of pounds on the table every month.
What to do with it:
Shift your marketing: Focus on the children who already attend part‑time. Have practical conversations with those families about whether extra hours would help them. Even with discounted rates, filling those timeslots can close the gap between your headcount and your FTE potential.
Adjust your schedule: Match staff shifts to real demand, or change your session options to encourage more full-day bookings.
The aim isn’t to fill every spot all the time. It’s to understand where you’re losing capacity and make smart choices to fix it.
2. Aged debtors and collection velocity
Cash flow brings down more nurseries than weak pedagogy ever does. You can look profitable on paper while still struggling to pay staff because parents have not settled their invoices.
Aged debtors – the total amount owed to you, broken down by how long it's been outstanding – is your early warning system. If this number is climbing, your cash position is deteriorating even if your revenue looks healthy. Most modern nursery software, like eyworks, can automatically generate an aged debtors report.
What to track:
- Aged Debtors Report: Breakdown the total value of debt by days (30, 60, and 90 days overdue). Your goal should be to keep the 60+ day category at zero.
- Total outstanding percentage: Measure this as a percentage of your monthly revenue. If your nursery operates on a 10–15% margin, a 20% debt ratio means you are effectively cash-flow negative.
Why it matters: Every month a £500 invoice goes unpaid is another month you are effectively providing free childcare. For a nursery chain, this can quickly tie up tens of thousands of pounds that should be used to pay staff wages and cover everyday bills.
What to do with it:
Target high-risk accounts: Use the Aged Debtors Report to move beyond generic payment reminders and engage directly with families who consistently pay late.
Leverage Integration: Encourage parents to link their HMRC accounts and cards to your nursery app. Give them multiple payment options to reduce payment friction and improve collection velocity.
Tighten your payment terms: Set clear payment terms and stick to them. Most settings are too lenient about late payments out of fear of seeming pushy, but parents respect consistency. If your terms say payment within 7 days, follow up on day 8.
Most importantly, automate your reminders. A systematic approach removes the emotional labour of having difficult conversations and ensures no account slips through the cracks.
3. Staff wage to revenue ration
Staffing costs typically represent 70 to 80% of a nursery's total expenses. This is your biggest lever for profitability – and your biggest vulnerability.
The staff wage-to-revenue ratio tells you whether your staffing model is sustainable. If you're spending more than the typical range on wages, you're hardly leaving anything for rent, utilities, resources, and repairs.
What to track:
- Staff wages report: Total staff costs as a percentage of total revenue.
- Agency vs core staff spend: Separate agency costs from core payroll in your reports. Agency usage is often the biggest leak in this ratio.
- Overtime hours: Monitor the overtime hours logged to identify if your base rota patterns are inefficient.
Why it matters: A high ratio means you're overstaffed for your revenue level. While you can’t slash staff due to statutory ratios, this metric forces you to look at the mismatch between your fee structure, occupancy, and staffing model.
What to do with it:
If your ratio is creeping above 85%, you have four options: increase fees, increase occupancy, optimise rotas, or restructure staffing.
Check your rota patterns: Are you consistently overstaffed at certain times? Can you restructure shifts to better align with actual attendance patterns?
Look for inefficiencies: High overtime and agency costs are red flags for staffing problems or poor rota planning. Every pound spent on last-minute cover is a pound not invested in retaining your permanent team.
4. Funding stream optimisation and income forecasting
Government funding accounts for a substantial portion of most nurseries' income, but it's also where the most revenue leaks and administrative errors occur. As children reach key age thresholds, their funding eligibility and rates change. If those changes aren’t applied at the right time, you can end up claiming the wrong funding, missing claims entirely, or continuing to charge outdated fees without realising it.
Income forecasting means predicting your future revenue based on current schedules, fee structures, and expected funding. The goal is to spot drops before they hit your bank account.
What to track:
- Income forecast report: Look at the projected revenue for 6 and 12 months out.
- Room transitions: Track the specific dates when children are due to move rooms. This acts as your early warning system for capacity changes.
- Funding eligibility: Monitor which children are approaching the age threshold for funded hours to ensure their fee structure is updated proactively.
Why it matters: A child turning three becomes eligible for universal funded hours from the following term. If that change isn’t applied at the right time, billing errors creep in and can run for weeks before anyone notices. You could also have "phantom occupancy", where a child is still listed as younger in your system after moving up. It can block new enrolments in higher-fee rooms. This means you lose income on both sides.
What to do with it:
Automate fee updates: Configure your nursery management software to automatically update its fee structure and funding eligibility. Most modern nursery finance software will include this feature.
Plan marketing: Use the room movement data to forecast vacancies and plan your marketing efforts accordingly.
Compare forecast to actuals: Large discrepancies indicate process breakdowns. usually point to process failures. They signal a need to review schedule updates, missed funding claims, or the application of fee changes.
5. Enquiry pipeline velocity and conversion rates
Marketing gets you enquiries. But enquiries don't pay the bills, enrolments do. Pipeline conversion rates measure how quickly you convert interest into confirmed revenue.
What to track:
- Pipeline stage conversion: Track the percentage of parents who move from "Enquiry" to "Visit" and from "Visit" to "Registered”.
- Time-to-enrolment: Monitor the average number of days it takes to close an enquiry.
- Number of enquiries: Number of enquiries is a leading indicator of demand and a reliable early signal for future occupancy.
- Drop-off Points: Identify the exact stage at which most parents drop out of your pipeline (for example, do they disengage after the visit or after receiving fee information?).
Why it matters: A slow pipeline can quickly lead to cash flow problems. If it takes 45 days to turn an enquiry into an enrolment and several families leave at once, you won’t be able to replace that income fast enough to avoid a cash crunch. A slow or leaky pipeline can also signal problems in your process. Are you losing enquiries because you respond too slowly? Are parents visiting but not signing up because your deposit process is confusing?
What to do with it:
Visualise bottlenecks: Break down each step of your customer journey and track how many people move forward at each stage. If 10 families enquire but only 40 book a tour, your response time or first message likely needs attention. If 4 families visit but only 1 go on to pay a deposit, the issue is probably in the tour itself or the follow-up that comes after.
Automate engagement: If you identify a lag in follow-ups, use automated email templates to keep prospective parents warm without adding to your workload.
Small optimisations compound into financial resilience
Most nursery financial crises don't announce themselves. They accumulate slowly. Your FTE utilisation drops by 3% one month, your aged debtors creep up by 5%, and your wage ratio edges past 78%. None of these individually feels urgent. But six months later, you're haemorrhaging cash and don't know why.
The nurseries that stay financially resilient don't have perfect operations. They have better visibility. They spot the FTE drop in month one and adjust their marketing focus. They see the increase in aged debtors and tighten their payment follow-up process. They catch the wage ratio drift and restructure a rota before it becomes structural.
Set a monthly review rhythm. First week of the month, pull these five reports. Look for movement, not absolutes. A single bad month isn't a crisis, but three consecutive months of decline in any metric is a pattern that demands action.
Then pick one thing to optimise. Adjust your session structure to capture more FTE. Automate your payment reminders to reduce aged debtors. Review your rota to eliminate inefficient overtime. You don't need to fix everything at once. You need to consistently make small, targeted improvements before small problems become existential ones.
Your profit and loss statement will tell you whether you made money last month. These five metrics will tell you whether you'll make money next month.